A product of OneDayCar
Know where your customers are.
Your customer data is sitting in a spreadsheet. PinPoint puts it on a map — and tells you what to do about it.
The problem
You have the data. You just can't see it.
Every dealership has a database. Thousands of customers, years of transactions, sitting in an export file. PinPoint takes that file and shows you exactly where your customers live, where your gaps are, and where your market is moving — nationally, not just down the road.
See your catchment
Visualise your entire customer base on a national map. Hotspots, clusters, density zones. Know your territory the way you know your showroom floor.
Find your gaps
Where are the customers you don't have yet? PinPoint scores your coverage and flags the suburbs where your competitors are probably winning.
Track the shift
Run PinPoint every six months and watch your customer base move. Midrand growing? Randburg declining? Know before it costs you.
See it in action
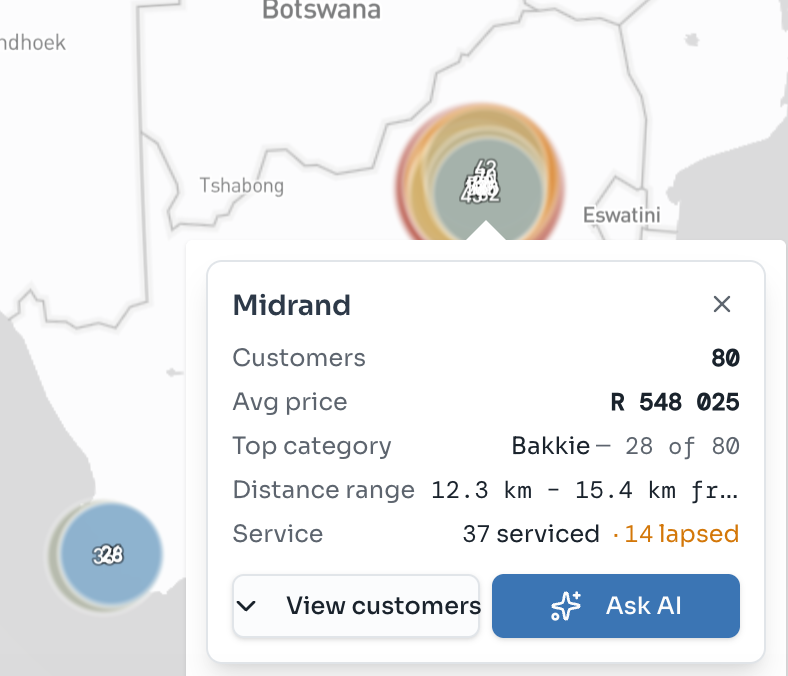
Every cluster tells you something.
Click any hotspot to see exactly who's there: customer count, average price, top vehicle category, distance range, and how many have lapsed on service. When you want to dig deeper, ask the built-in AI in plain English.
- See exactly where your customers live — not just which city, down to suburb level.
- Know which areas are growing, which are slipping, and where you're not reaching at all.
- Surface lapsed service customers by suburb — and estimate the rand value you're leaving on the table.
- Track whether your marketing spend in an area is actually converting into customers.
- Understand what each suburb buys — price point, vehicle category, new or used — so your stock and campaigns match the market.
How it works
Three steps from spreadsheet to insight.
Upload your data
Export your customer list from your DMS. CSV or Excel, any format. Our system handles the rest.
Get your map
Within minutes, your customers are plotted nationally. Hotspots identified, distances calculated, insights generated.
Ai answers tailored to your data
Use the built-in AI to ask exactly what you want to know. "Where should I focus marketing this quarter?" Just ask.
Pricing
Simple pricing. No subscriptions. No surprises.
Pay per run. Your first run maps your entire customer base. Every run after that, you only upload customers added since your last run — most dealers find their second run costs a fraction of their first.
- National map
- Sales & service layers
- AI insights
- 12-month retention
- National map
- Sales & service layers
- AI insights
- 12-month retention
- National map
- Sales & service layers
- AI insights
- 12-month retention
- National map
- Sales & service layers
- AI insights
- 12-month retention
- National map
- Sales & service layers
- AI insights
- 24-month retention included
- National map
- Sales & service layers
- AI insights
- 24-month retention included
- National map
- Sales & service layers
- AI insights
- 24-month retention included
Keep your run, map and chat history active for 24 months instead of 12, and unlock full multi-run comparison history. Complimentary from Group band upwards.
Referrals
Know another dealer who needs this?
Refer a dealer to PinPoint and earn 15% cash back when they complete their first run. They get 15% off. You get paid. No limits. Anyone can apply — you don't need to be a PinPoint dealer yourself.